What’s the ‘trampoline’ of social housing? The hidden improvements in housing + health data.

Our team has been working on a series of projects in recent years designed to improve the health of residents in social housing and create greener, cleaner neighbourhoods. Here, Director of Innovation & Net Zero, Balazs Csuvar sets out the wider potential of housing data when allied to health metrics – and invites you to share the ‘trampolines’ in your neighbourhood…

Ask any paediatrician or A&E consultant about garden trampolines and you will likely get the same withering look. For many in the medical profession, they are a public health hazard disguised as harmless fun that accounts for half of all garden play equipment injuries in under-14s. But the paradox is that we, as a society, willingly introduce them into our homes.

The challenge for those of us working in social housing is to identify the ‘trampolines’ we introduce (or don’t remove) from the homes of our tenants. What are the design choices or maintenance habits we continue to deploy that are invisible health traps? Not the clear Category 1 hazards that we monitor, but anything in a home that is fine for most, but could be dangerous for specific cohorts.

We encourage you to consider the architectural or planning equivalents of the trampoline: hazards that drive predictable injuries, mental stress and chronic illnesses among our residents. The intention is that if we can better identify them, we can ‘remove’ them, reducing injury and suffering for our tenants and saving billions for the NHS.

What if the data we hold on housing stock could be mapped against injury data to identify clusters and prioritise work that improves health? 

Our proposition is to integrate some of the tools and systems developed through our housing asset management work (see our Home by Home plan) with healthcare data, such as A&E admissions or GP respiratory diagnoses, against our property dashboards. This allows us to pinpoint where the propensity for certain conditions might cluster, highlighting housing estates that require closer attention. To remain close to our original ‘trampoline’ hypothesis, we have focused on burns and falls for over 65s. 

Unaddressed fall hazards in homes cost the NHS over £435 million a year - they are the number one reason for attending A&E for over 65s. The vast majority of falls happen inside the home, with the main causes being clutter, poor lighting, uneven or slippery surfaces, dizziness and poor vision. 

One interesting point we’ve seen in the data is that maisonettes have a slightly higher rate of hospitalisations compared to other housing types. Whilst the data is not conclusive and requires further scrutiny, it’s the sort of insight we can identify and make actions to improve upon. If we think of the narrow stairs going up to the apartment, there might be a simple mechanism to identify and address.

What could we do?

Let’s consider how we might design these hazards out of our stock. Awareness and a menu of potential mitigating actions for officers to consider might be a great first step. We can focus on reducing catastrophic falls by mandating low-level, motion-activated LED lighting in stairwells, securing floor boards or carpets. We can replace standard vinyl with high-friction, anti-microbial wet-room flooring that can stop slips and limit the build-up of pathogens. In case falls happen, smart devices and alarms can be better implemented to support vulnerable residents.

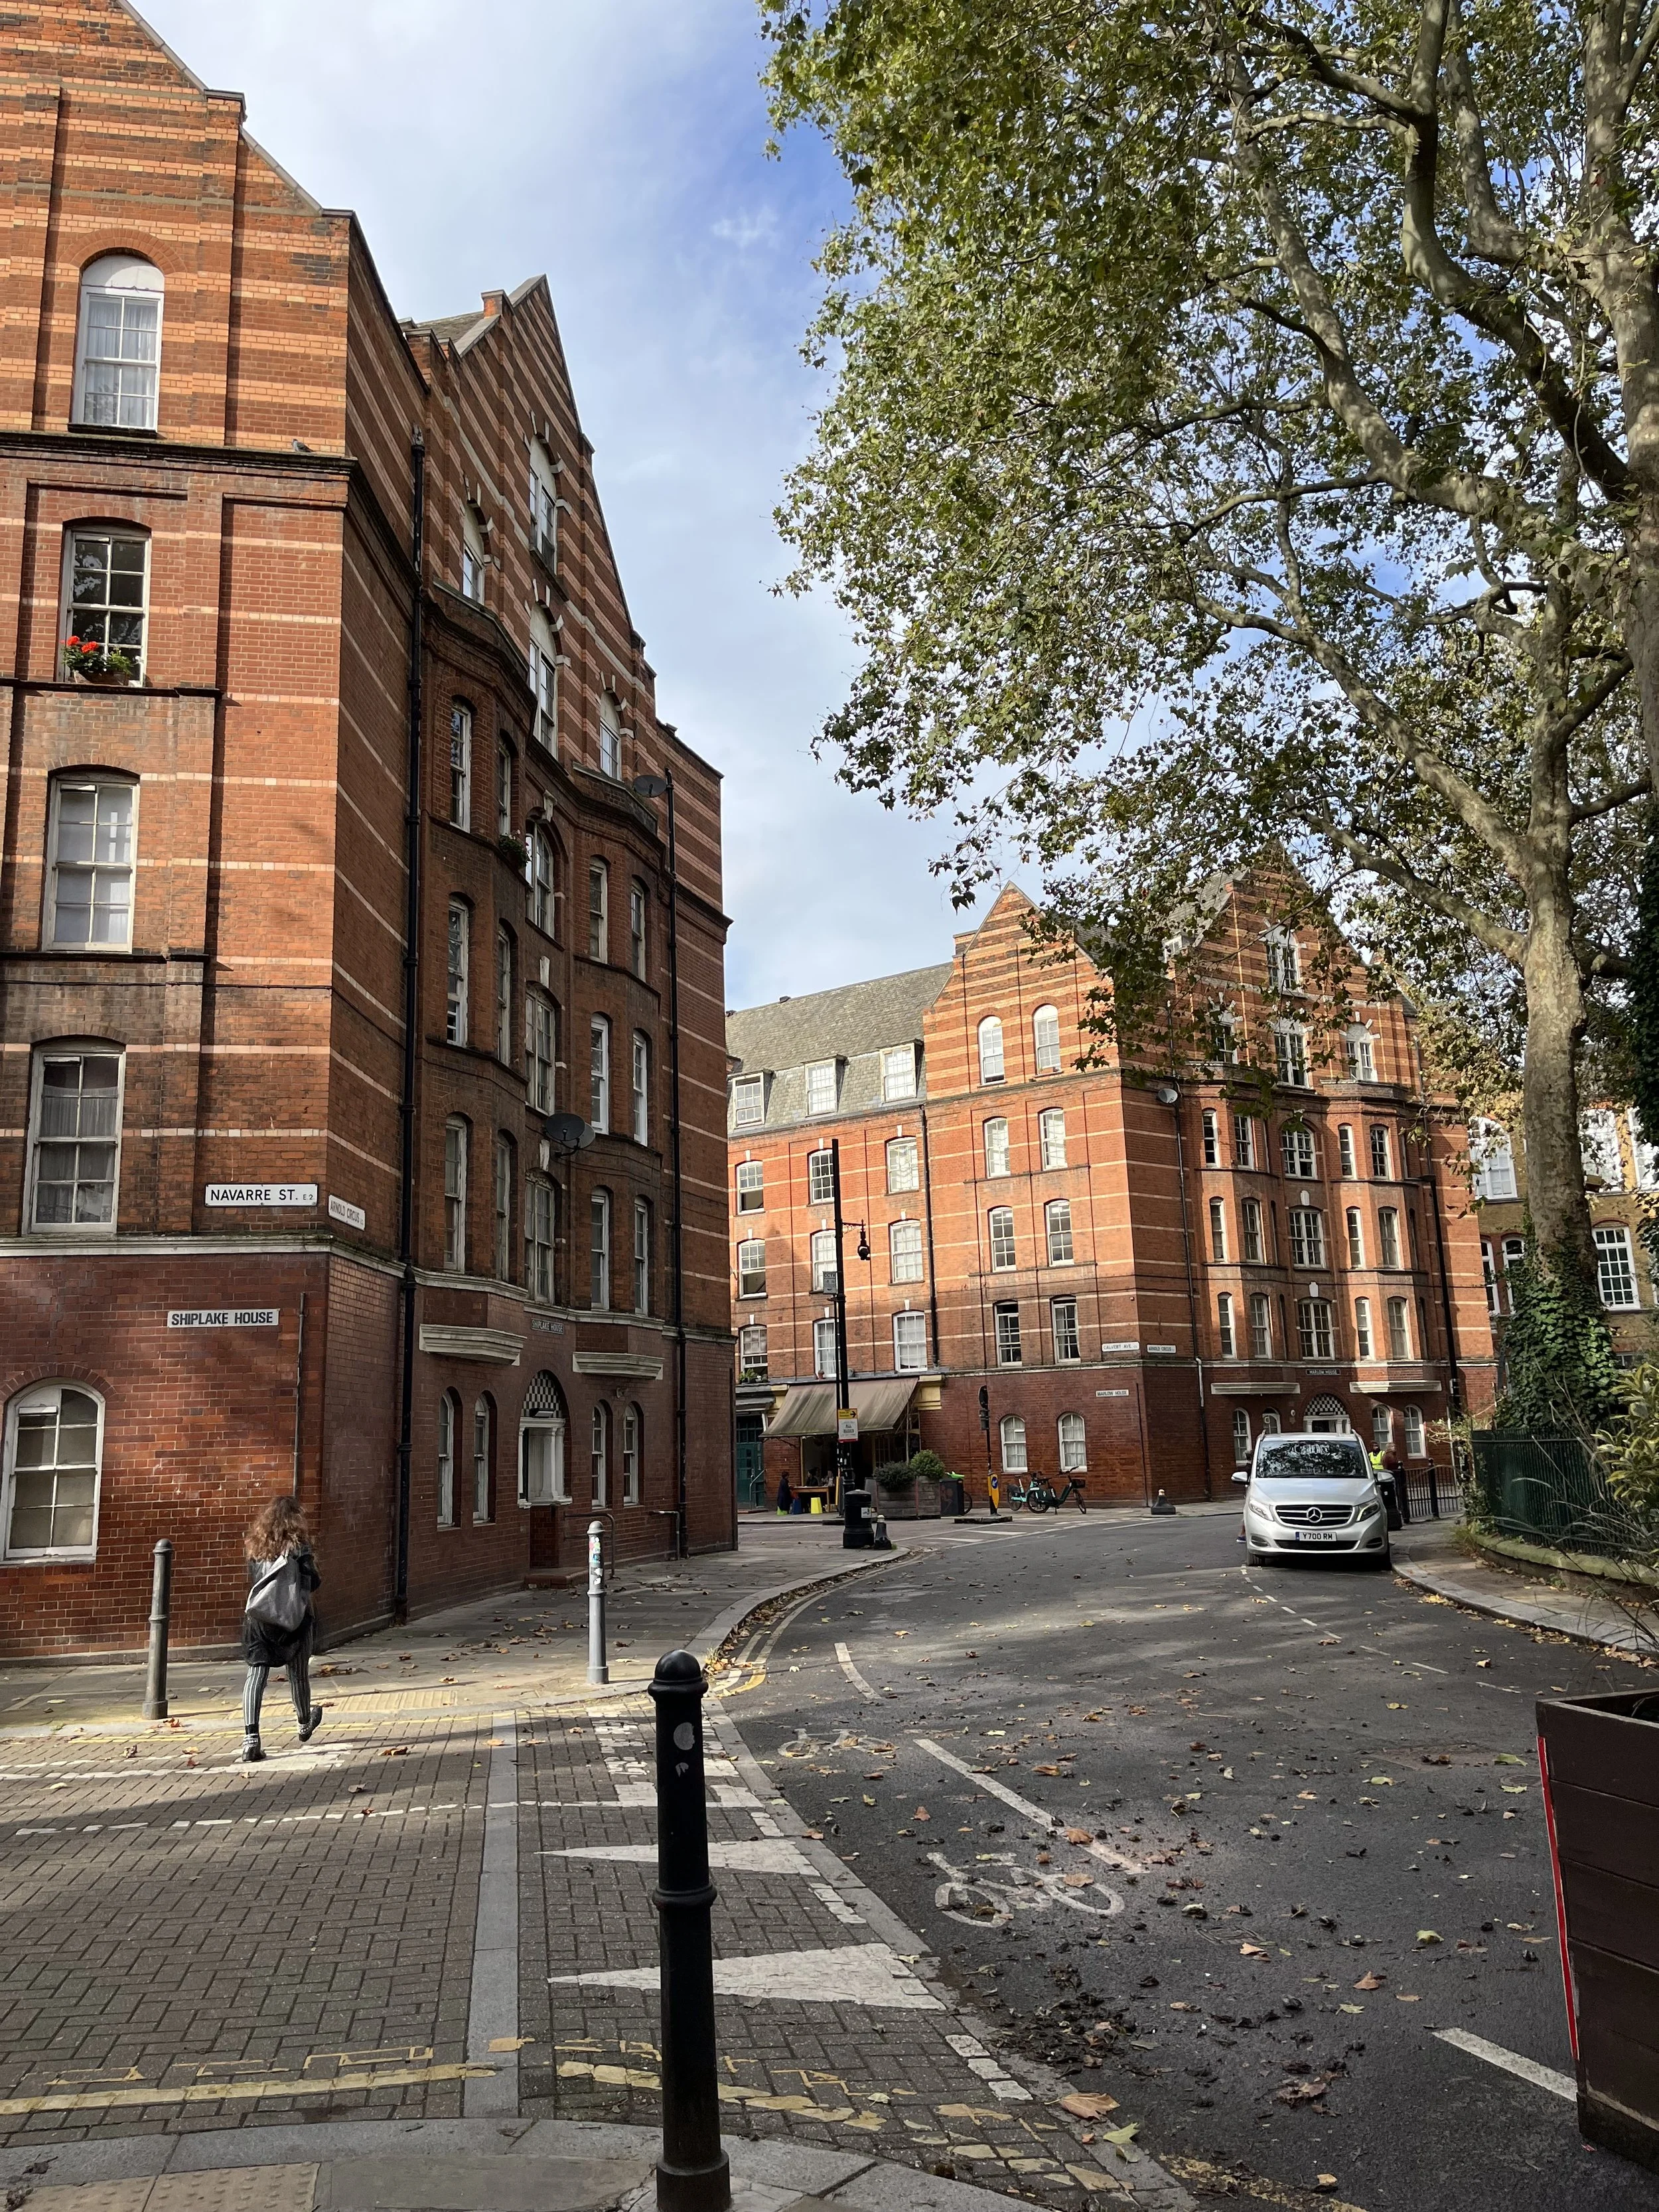
Arnold Circus, East London

Since the nineteenth century, the history of social housing has been a timeline of innovations and architecture designed to improve living standards and public health. Today, we have the technology and data at our disposal to enable the next shift towards more resilient, greener, healthier neighbourhoods. In many of our projects we use dashboard analytics to prioritise which areas require the most urgent interventions – we see the next move as a broader framework where housing capital works are directly correlated with health outcomes. 

We welcome your suggestions

At the moment, we’re interested in the wider potential of our work with data and housing to be applied to specific health and safety issues. With that in mind, we want to work with housing professionals, environmental health officers and residents to identify which overlooked features in the home are waiting to be designed out.

What do you see as the 'trampoline' in your home or neighbourhood? And how can we work together to conserve and improve our housing stock for the long term? Get in touch with me with your issues and ideas for collaboration: [email protected]m

New research: what Behavioural Systems Mapping can reveal about digital inclusion at a neighbourhood level

This week, we’re excited to launch findings from our research into how behavioural systems mapping can bring new understanding and solutions to address digital exclusion in older adults - a project we delivered with five local authorities in collaboration with University College London. Director of Research & Insights, Ed Houghton explains the difference solutions can make when thinking shifts to ‘cause’ from ‘effect’ and takes into account the wider neighbourhood.

Understanding what drives digital inclusion is a challenge for many across the public, private and third sectors. The digital divide is changing, but not for the better – whilst more people are connecting to and making use of the internet, those that are excluded are becoming even more so. This deepening of the divide, which acts to exacerbate the negative impacts of digital exclusion, is only going to get worse with ubiquitous technology that continues to evolve. Taking active steps to lessen the digital divide must become a priority.

Many organisations across the country are working hard to reduce the impact of digital exclusion; helping people gain access to the internet, become confident and capable in how to use it and supporting them to safely navigate it. From Digital Champions programmes that use a peer-to-peer model of learning, through to excellent device lending and re-use schemes, there is a lot happening to help people.

But a major challenge many programmes face is that often they focus on the “effect” end of digital exclusion – the person needing support. While this is vital, and can generate tangible benefits for individuals, it doesn’t necessarily change the “cause” side of the equation. The pressure to change is instead on the individual to flex and accommodate digital services or tools, learn new skills and shift their habits and beliefs to make use of services.

It is for this reason that we undertook research as part of the UK Government’s Digital Inclusion Innovation Fund to trial a new method, Behavioural Systems Mapping, to help unpick the systemic factors that are driving individual digital exclusion. Our aim was to see whether or not it is possible to reorient the focus of our thinking; to move from ‘effect’ to ‘cause’, to change the system so that it better accommodates and supports those most vulnerable in our society.

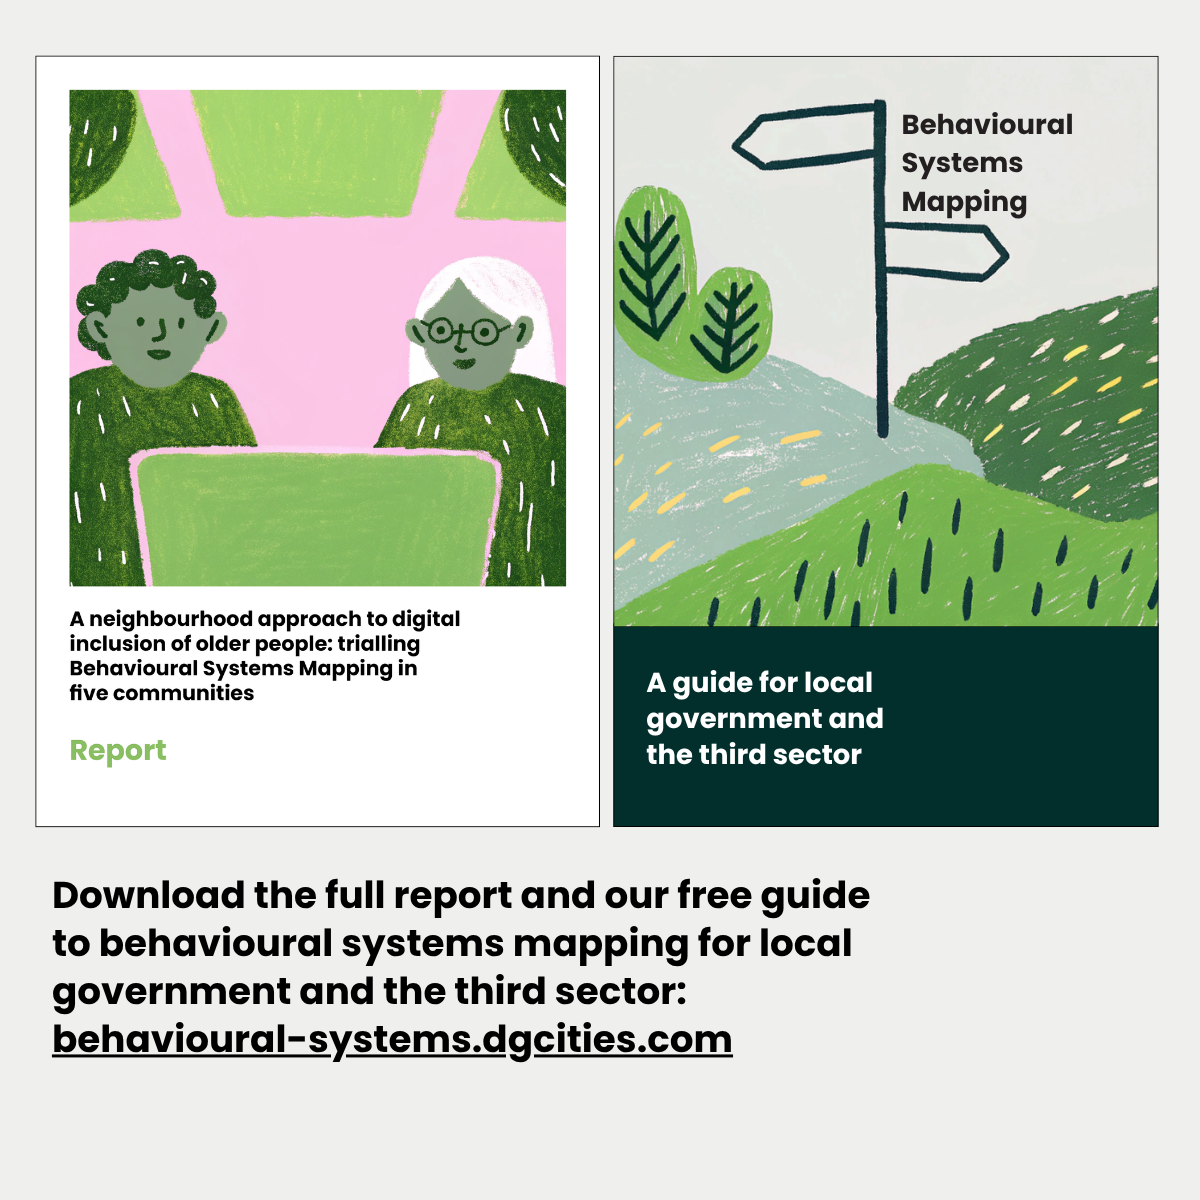
Our focus was on supporting older people, exploring neighbourhood dynamics that influence the digital exclusion of people aged 60+. This week we’ve published the findings of our research, and a new guide to help public sector and third sector professionals to explore the method and apply it to their own work.

Seven months, five local authorities

Over the course of seven months, we worked in five neighbourhoods across the country to trial Behavioural Systems Mapping with local authorities and their third sector and NHS partners. With our consortium partners the Royal Borough of Greenwich, Ealing Council, Haringey Council, Leicester City Council and North East Lincolnshire Council we ran four workshops, a mix of online and face-to-face sessions to develop maps from the ground up – defining actors, their behaviours and the drivers shaping them.

Using this map we then identified leverage points – the places where changing the system is likely to create impact – and worked with each neighbourhood to develop intervention blueprints that describe the policies, processes and activities that could be implemented.

Throughout the project we tracked important lessons from the process to understand the feasibility of Behavioural Systems Mapping, and the value it brings to local government teams. We wanted to assess not only if the interventions were well aligned to the neighbourhoods (e.g. not off-the-shelf, but designed for their context), but also what could be done to improve mapping and the outcomes of the process. We then used these lessons – like ensuring user engagement throughout, and making sure not to overly complicate the map by being more focused, to develop our guidance for the public sector.

So, what did the study reveal?

Firstly, Behavioural Systems Mapping is an effective diagnostic and design tool for addressing neighbourhood-level digital inclusion among adults aged 60+. There were added benefits to it too, particularly in bringing stakeholders together around the same table (virtual or otherwise) to share their perspectives and explore the system they work in together. Secondly, by uncovering systemic drivers, the mapping process revealed that local digital inclusion issues are in fact grounded in distinct behavioural systems. Thirdly, when backed by expert facilitation and mixed-methods data, each neighbourhood managed to generate targeted interventions ideas.

However, the methodology does have limitations: resulting maps were highly complex and required time to embed and navigate. Also, because these maps primarily reflect stakeholder perspectives, direct community engagement is essential to validate underlying behavioural assumptions and stress-test the resulting interventions. Engagement became a vital part of the method, which in the future we would ensure is embedded throughout.

We’ve captured the findings in an easy to explore website, where you can also download the reports and guidance.

We think there’s a lot of potential in Behavioural Systems Mapping as a method for a variety of issues and we’re excited to see what others do with this in their work. It is truly participatory and provides a valuable step-by-step approach to reveal hidden or undescribed factors that shape digital exclusion. The resulting outputs are the result of deep collaboration and shared understanding of complex systems and we think that thinking and acting with this in mind is the way to unlock digital inclusion for those most vulnerable in our communities.

If you have any questions or would like to find out more, get in touch!

LOTI workshop: connecting digital inclusion + health through Behavioural Systems Mapping

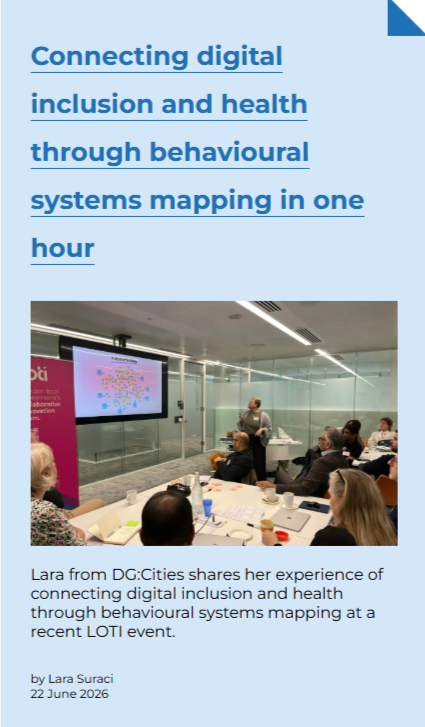
As public services increasingly adopt digital-first services, it’s becoming impossible to separate digital inclusion from equitable healthcare access. Behavioural Scientist, Lara Suraci explores how Behavioural Systems Mapping (BSM), a collaborative method we have been using to map behaviours and their drivers within a complex system, could offer ways to bridge these two areas.

Initially developed by DG Cities to address broader digital infrastructure challenges, BSM consistently revealed how intertwined health literacy and digital exclusion have become. To test the versatility of this framework, LOTI conducted an experimental, high-speed one-hour BSM workshop at their Digital Inclusion Symposium. Bringing together a diverse group of healthcare professionals, service designers, and community representatives, the session tackled a specific health crisis: annual flu vaccine uptake among digitally excluded older adults.

Even within the tight timeframe, the exercise successfully captured 32 behaviours and 22 drivers, shedding light on the immense value of offline social infrastructure, such as trusted community figures and informal family networks. It illustrates BSM as a live, strategic tool. As the NHS shifts care from hospitals into communities, BSM provides local government and healthcare providers with a way to visualise system-wide complexities, moving past oversimplified narratives of ‘hard-to-reach’ groups to design interventions that make healthcare engagement possible, easy, and beneficial for everyone.

Read more over on LOTI’s blog.

Can Behavioural Systems Mapping help make neighbourhoods more resilient to extreme heat?

As record-breaking temperatures scorch Europe and expose the dangerous vulnerabilities of our infrastructure, the urgent need for comprehensive climate strategies has never been clearer. The focus needs to shift from individual crisis management to systemic solutions. By applying a Behavioural Systems Mapping lens at the neighbourhood level, can we dismantle systemic barriers and leverage local community connections to build lasting heat resilience? Director of Research & Insights, Ed Houghton puts the method to the test…

Goraivis/Unsplash

This week, much of Europe has been subject to extreme temperatures. In England the hottest ever June day was recorded in Gosport, Hampshire on Wednesday where the mercury hit 36.1 degrees Celsius. As a ‘heat dome’ settled over Europe, dangerous temperatures have had major impacts on lives – and in tragic cases have caused fatalities, driving up emergency call-outs as the most vulnerable in society have struggled. There has been little let up as the week has gone on: infrastructure has buckled, workplaces and schools have closed and many stayed home, only to find little respite in UK housing stock not built for temperatures in the late 30s.

It may come as some surprise, but in cities such as London there has been, until this week, very little I the way of a clear strategy to deal with such extreme temperatures. And whilst science has proven the ever-increasing likelihood of extreme weather events due to climate change, policy-makers have been slow to put in place plans to help manage and mitigate such events.

Only this week, London published its Heat Ready London plan, the capital's first-ever comprehensive plan designed to protect the city from the escalating threat of extreme heat. The plan highlights the sheer scale of the city's vulnerability, noting that approximately one million London homes, along with more than 1,300 schools, 60 hospitals, and 351 care homes, are currently located in high-risk areas for overheating.

Heat Ready London provides some clarity on the steps the Mayor will take to realise the vision of a city resilient to weeks such as this: protecting the most vulnerable people, retrofitting existing buildings to stay cooler, expanding access to public cooling spaces, and fortifying critical infrastructure. Because extreme heat disproportionately impacts those living in poorly designed homes or areas lacking green space, the plan frames climate resilience as an issue tied to inequality in our communities.

There is a clear framing of the systemic barriers that shape how extreme heat impacts us: those with access to transport can easily get to cool spaces, those with disposable income can spend time in recreational spaces such as cinemas, whilst many have little means to cool their homes, and for many on low incomes in social housing, the housing stock is not prepared for temperatures. To overcome these issues, we need to use a systems lens on the issue of extreme heat.

Shifting the lens from individual to system

Moving to a systems perspective is a powerful way to reframe an issue as complex as extreme heating. And to build resilience that is effective, it isn’t enough to act as individuals – instead, there must be real change at the level of organisations, through policies and practices, as well as into the cultural norms of behaviours that must change over time. Building communities resilient to heat is something all parts of our communities must collaborate on to make real change.

That’s why we think there might be value at rethinking extreme heat at the level of neighbourhoods. The neighbourhood is the level at which many people and families spend their daily lives – how people access local services, go to school and places of worship, and live with families and friends, building close communities. Important social and cultural phenomena also exist within close communities, within neighbourhoods – social cohesion and connection, how close people feel to their neighbours and their community, and individual histories and ancestry can also mean that mean people have strong bonds within neighbourhood spaces.

This is the level where we should build resilience.

The Behavioural Systems Mapping method is one way we’ve been exploring behaviours through a systems lens. As our blog on our work on digital inclusion highlights, there are many ways that this method can help communities to rethink the nature of a challenge and explore the steps they could take. And given the method’s value as an exploratory tool to understand the nature of an issue, this week we thought we’d trial it on a theoretical neighbourhood experiencing extreme heat.

What our Behavioural Systems Map tells us about managing extreme heat

Working as a team we rapidly mapped the actors, behaviours and drivers that shape how a neighbourhood will respond to an extreme heat scenario. We captured ways in which we each experience extreme heat, as well as the steps that we’ve seen policy makers and important institutions, such as the NHS or Met Office, play a role in responding to the extreme heat we’ve experienced this week. We played through as a simulation exercise what a map could look like – and through the process came up with key themes that help to categorise behaviours and make the map more tangible.

Below is the map we built:

What did we discover?

What we found from mapping was threefold.

Firstly, the sheer size and scale even for a neighbourhood example meant that the scenario required many actors, each with many behaviours. We quickly realised it would be useful to collapse behaviours and actors together where possible to make the map more actionable, but being careful not to dilute.

Secondly, there are many potential leverage points (points where we could expect to take action to change the system) that exist across different actors – from the NHS communicating information, through to Local Authorities supporting community organisations to share advice and check in on elderly people.

And finally, overlaying the Capability, Opportunity and Motivation model of behaviour (COM-B) is a great way to create a better understanding of what shapes behaviour in this scenario, and importantly, what could work as a more targeted intervention to tackle the specific driver of behaviour in play – e.g. improving knowledge of home cooling, a clear capability (skills) issue.

This type of mapping is very useful for showing complexity – as you can see. It makes a major systemic challenge more tangible, breaking it down into parts where change becomes more visible.

But we’ve only really built Version 0.1. This is a sketch from our own understanding and reading on the topic, but by no means is this a complete map – in fact, there never will be a complete map. Instead, this is a useful starting block from which dialogue and conversations can build, with experts and those experiencing the impacts of extreme heat. This, we think, is the real benefit of Behavioural Systems Mapping. As an exploratory tool for helping us to navigate an issue and find our way through. Just like a map should do.


We’d love to have your input on the map. What are we missing? What do you agree/disagree with? Get in touch with Ed: [email protected]

From data to decisions: how the Home-by-Home plan is transforming housing asset management

What started as a capital investment prioritisation tool for the Royal Borough of Greenwich has become a cross-cutting intelligence platform, now being applied to damp and mould response, regeneration, retrofit and stock condition surveys. Here’s Net Zero & Innovation Consultant, Rasheed Sokunbi on what we’ve learned so far.


When it comes to housing asset management, every social landlord has the data. There’s information out there on responsive repairs, planned programmes, EPC certificates, compliance and more. The problem is that this lives in silos, ages quickly and rarely informs investment decisions when it matters.

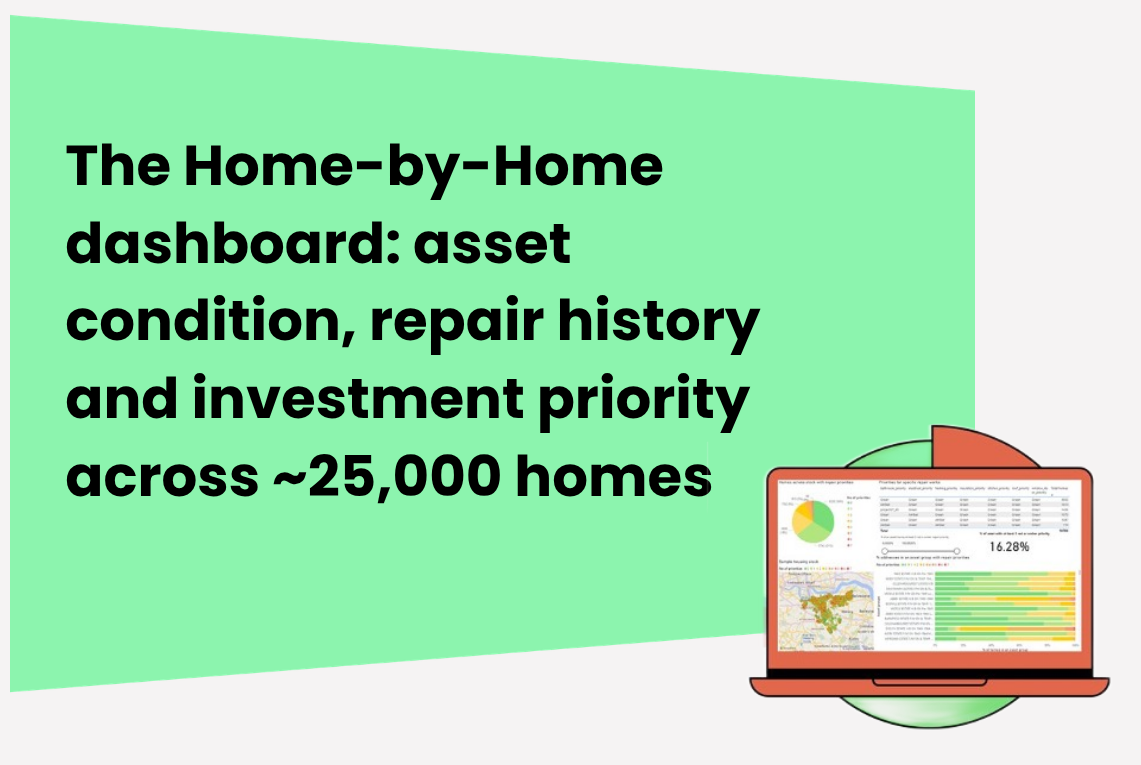
The Home-by-Home Plan set out to change that by bringing it all together into a single, property-level view of condition, risk and need, turning it into a prioritised, evidence-led capital programme.

Case study: the Royal Borough of Greenwich

We have been working closely with the Royal Borough of Greenwich to apply the Home-by-Home Plan and make it even more useful to the housing teams. What began as a capital investment tool has now expanded into many distinct programmes, building on the original plan:

  • Capital investment prioritisation: RAG (Red, Amber, Green Prioritisation) system used to rank every home, estate and asset group based on need and repair spend across the entire portfolio. Helped the team to determine where capital spend should go.

  • Damp and mould sensor allocation: Cross-referencing repair history and disrepair data to target IoT sensor deployment to the highest risk homes first.

  • Regeneration appraisal: Identifying stock where repair spend and remaining asset life make continued investment harder to justify.

  • Retrofit and net zero prioritisation: Scoring homes by EPC rating, fabric condition, repair history and renewable dates of common retrofit assets (windows, doors, insulation) to create a sequenced, fundable retrofit pipeline.

  • Stock condition survey allocation: Mapping where survey data is missing or outdated to prioritise future survey commissions and close data gaps. 


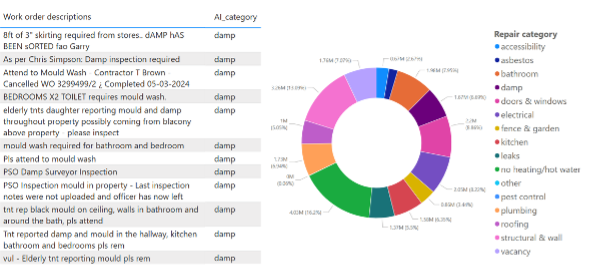
AI (LLM) was used to help categorise over a million rows of reactive work order history


What issues are other landlords coming to us with?

The conversations we have been having with housing associations and councils tend to start in the same places: data that exists but has never been joined up; Awaab’s Law pressure with no proactive targeting methodology; retrofit commitments with no delivery pipeline; regeneration decisions that lack an evidence base. The advantage of the Home-by-Home Plan is that it does not require perfect data to start delivering value. Instead, it is designed to work with what you have, surface the gaps, and build a picture that gets sharper over time. The model can also be used to evaluate current capital programmes o ensure that funds are being spent in the right areas.

“The Home-by-Home Plan has fundamentally changed how we have conversations about investment. We no longer walk into a programme meeting relying on gut feel or whoever surveyed last. The data is there, it’s consistent, and it gives the whole team confidence that we’re spending in the right places.”
— Asset Data Manager, Royal Borough of Greenwich

What are we learning?

As the tool has been refined and applied, we’ve gained a deeper understanding of some of the issues housing teams are facing and how we can help. For example, in delivering more holistic insights. The data is almost always there, but sometimes it’s fragmented. Repairs systems, survey records, compliance logs, stock condition data: every housing provider has more than they think. The challenge is joining it up, not finding it.

Another hard part of the process is trust. Getting housing teams to act on data rather than instinct takes time. Getting a working view in front of officers quickly matters more than waiting for perfect data quality.


We’ve also learnt that different providers sometimes have different priorities. The model has to be flexible enough to surface what matters most to each organisation, whether that is compliance, building an asset management strategy or retrofit programmes.

Then there is the regulatory context. The Regulator of Social Housing’s own judgements make the scale of this problem hard to ignore. Of all C3 and C4 providers 88% had data cited as an issue. The most common specific problems were stock condition data and data quality and accuracy more broadly. In practice these are almost always the same issue: not knowing the true condition of the housing stock. The Home-by-Home Plan exists precisely to close that gap.


If you’d like to find out more or have an informal discussion about the plan’s applications, get in touch with Rasheed and Balazs via email or fill in the form here. Also, keep an eye out for our new benchmarking tool to help compare housing providers using government assessment data.

Surprising systems behind digital exclusion data

We’re getting ready to launch some exciting new multi-council research - it offers lessons that could improve the lives of millions of older people across the UK. Before we do, we wanted to set the scene with a look at the context. When did the digital divide turn into digital exclusion? How is that challenge evolving next? And does typical usage data really tell the whole story about how older people are using technology?


When people started buying televisions in the 1950s, of course, they were expensive. If you were flush enough to own one, it often ended up being communal; your neighbours might gather around it to watch news or major events, such as Queen Elizabeth’s coronation in 1953. This is something my father remembers and it’s interesting, because a similar situation is playing out around online access in his neighbourhood today.

My dad, now in his 80s, has always been an ‘early adopter’ of technology, from his (mostly signal-less) car phone in the 1980s to the company computer he invested in (which took up a whole room to deliver an astonishing processing power of 35k). So, while my parents have become less physically mobile, they have been able to benefit from online services, such as grocery deliveries to the door. They were confident using devices and different apps to stay in touch with family while isolating during the Covid-19 pandemic.

However, like the television buyer in the 1950s, it appears they have become a hyper-local hub. I discovered that when they book their weekly online supermarket order, they add extra groceries for an elderly neighbour, who doesn’t have a laptop or smartphone, but gives them a shopping list. They also access online services to support another relative that isn’t able to use the internet.

Apple computer monitor showing sky news footage of King Charles and Queen Camilla coronation, on a desk, black and white

It’s not an ideal solution perhaps, but if you surveyed their local situation, in pure data terms you would likely have an incomplete picture. Of three households, two would be classed ‘digitally excluded’, with no broadband, limited IT skills or devices, yet there are hidden social systems at work that enable them to access services. The story that emerges through mapping these systems, the specific barriers, behaviours and even the role of the ‘trusted local actor’ is particularly relevant to DG Cities recent work on digital inclusion.

The digital divide deepens as it appears to narrow

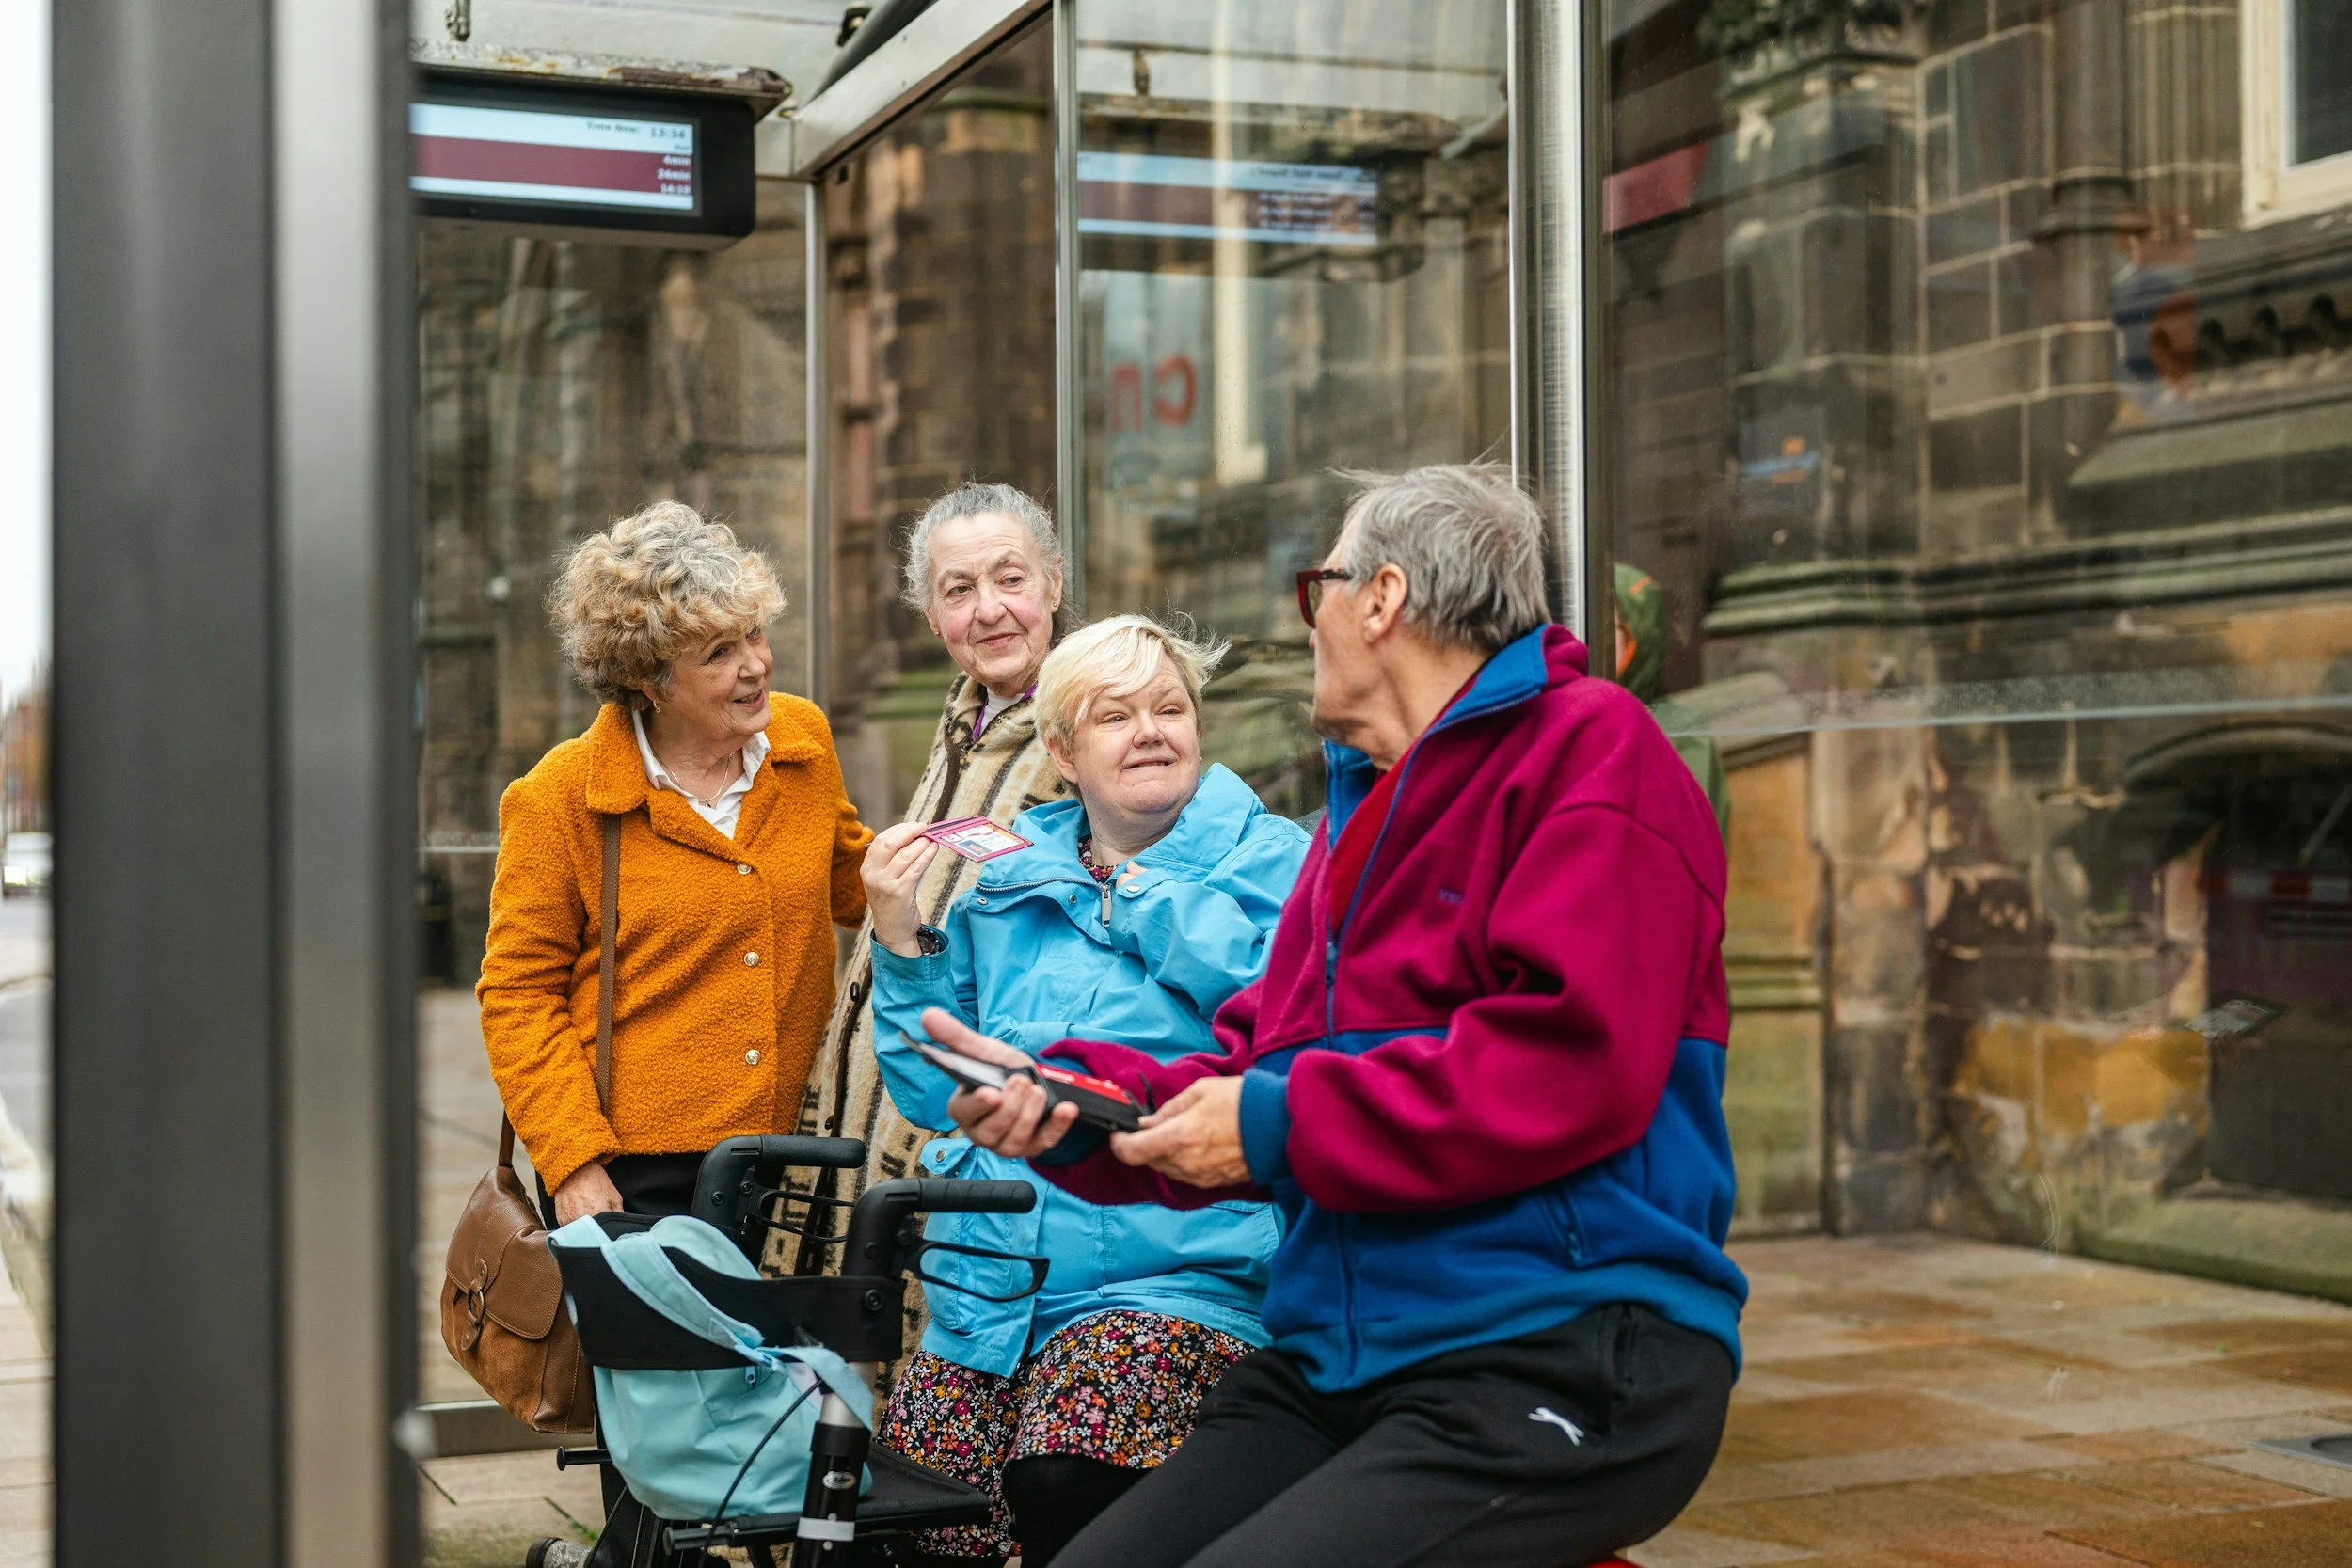
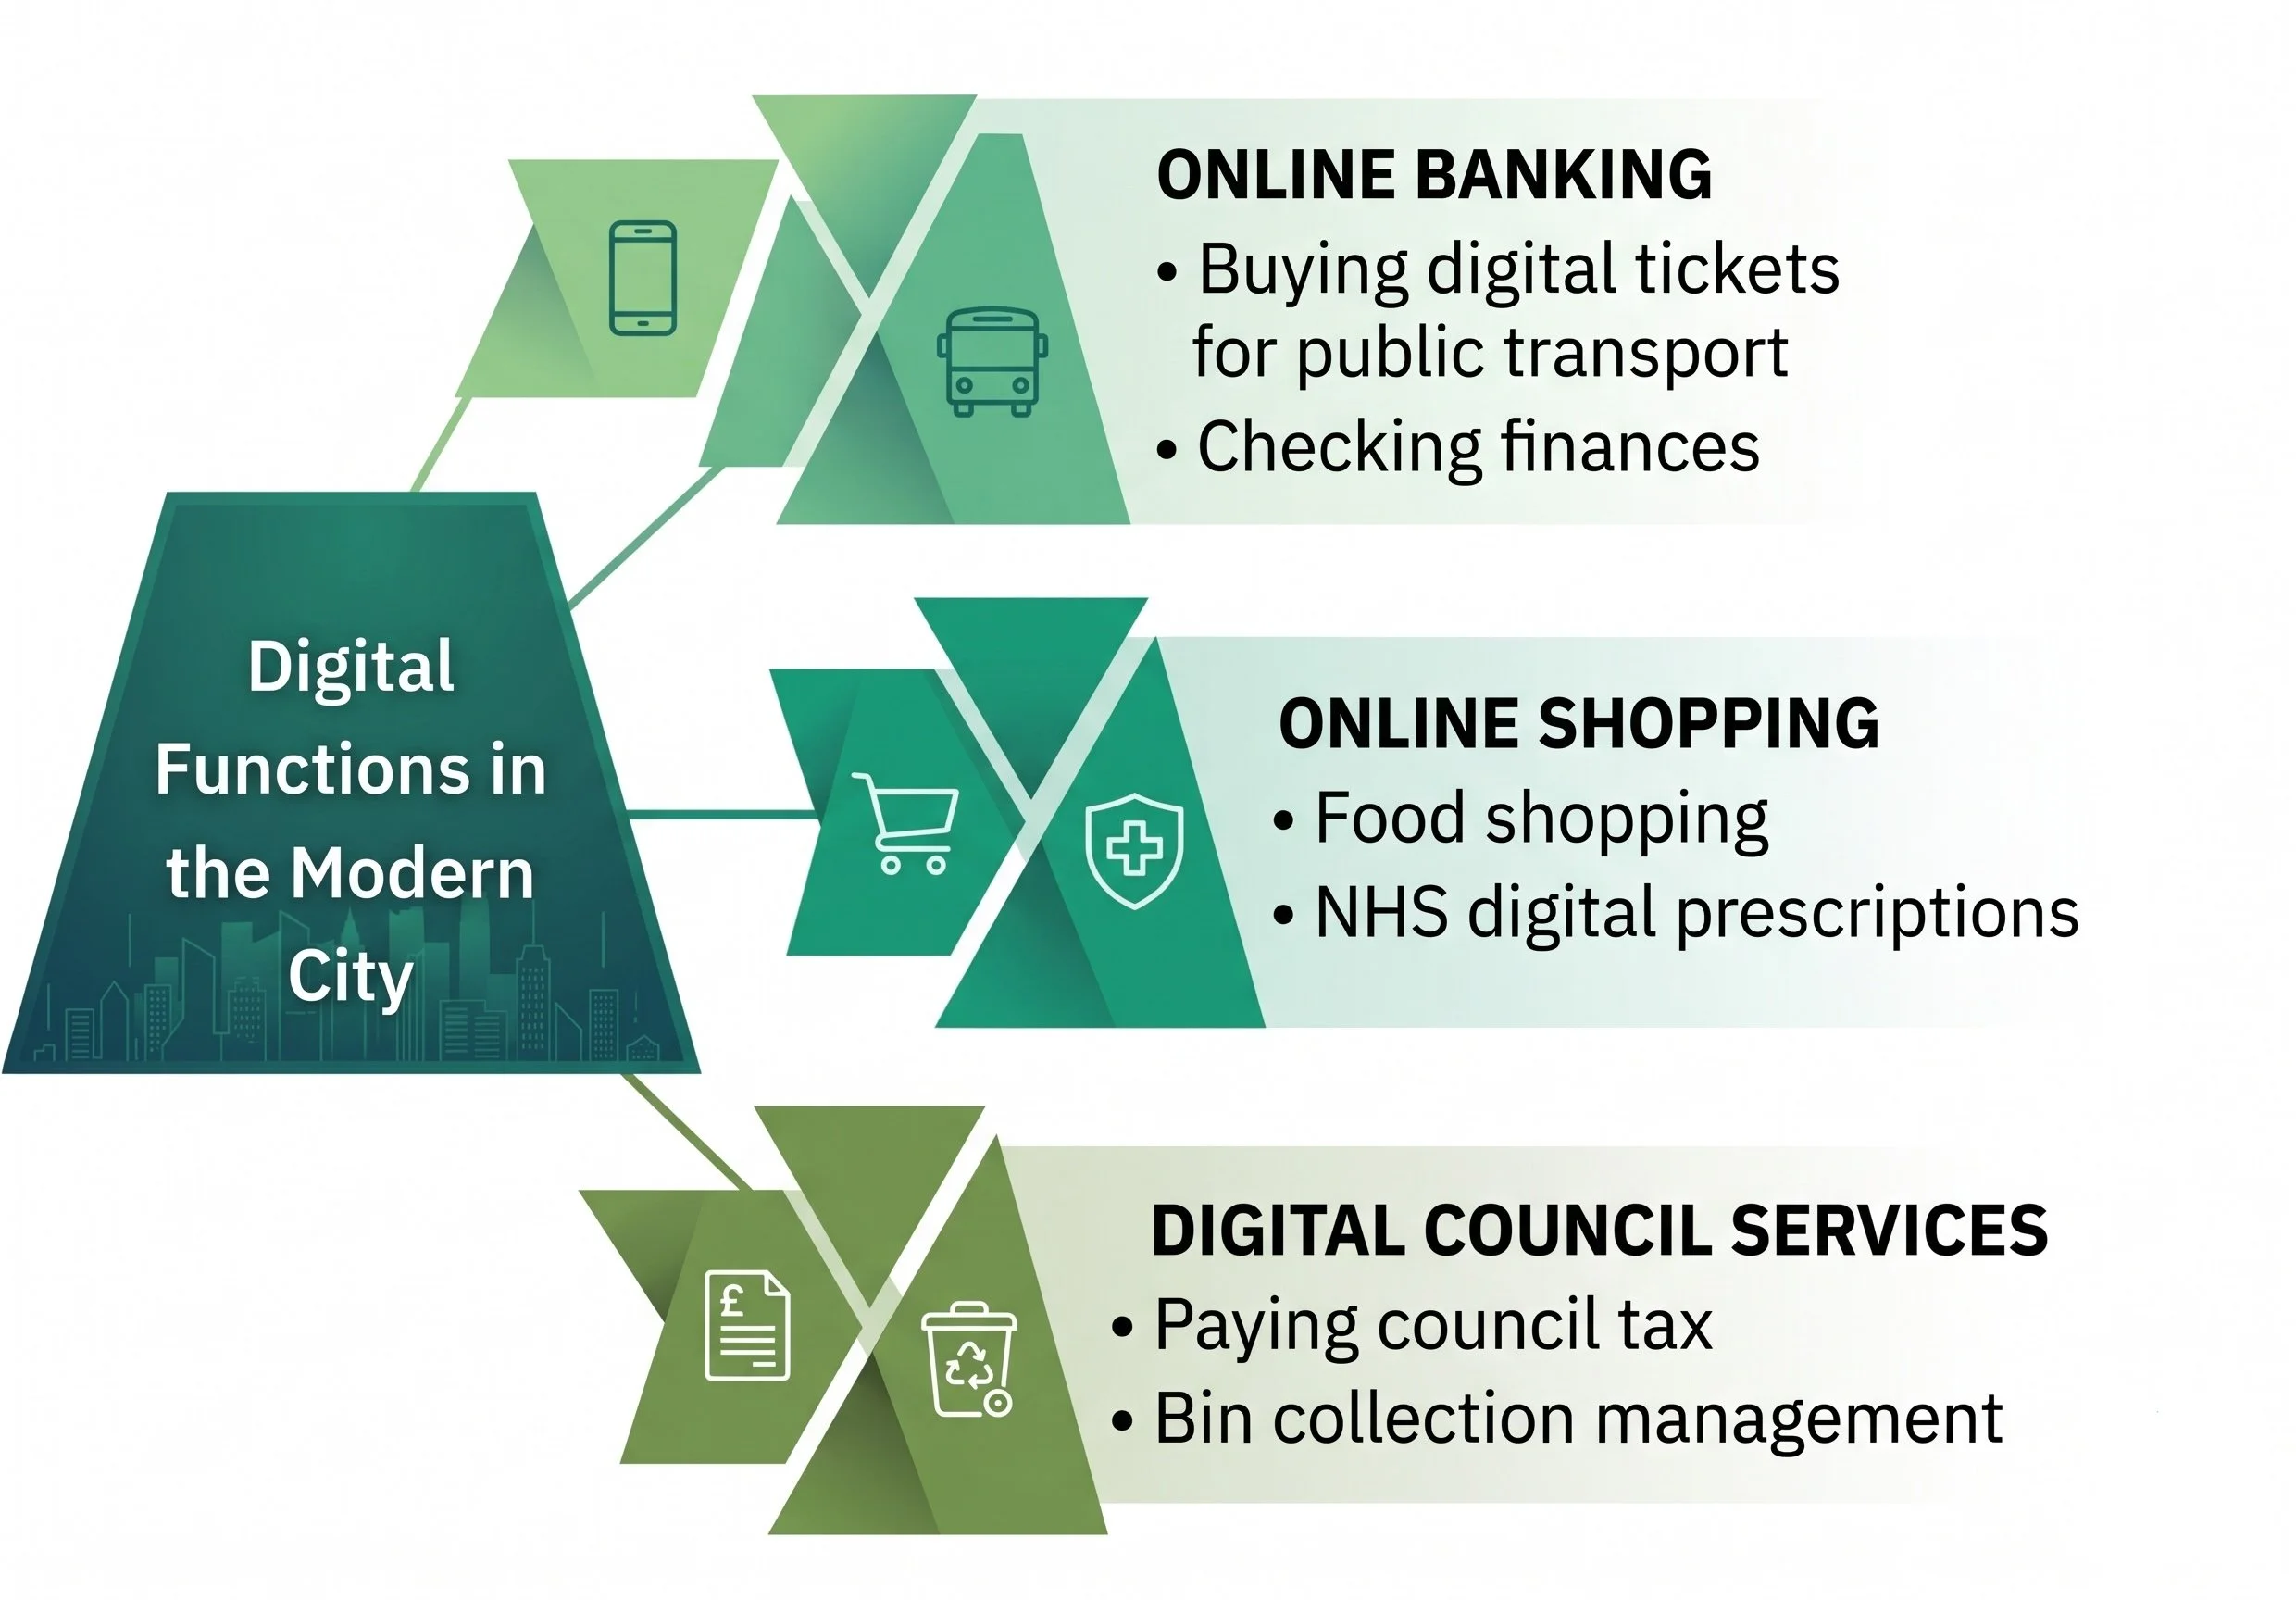
Data alone doesn’t lend itself to easy explanations as to why, despite widening access to devices and training, many older adults are still offline. While absolute numbers of non-users are dropping, according to Age UK research, 2.3 million people aged 65+ (1 in 6) still do not use the internet. Over 4.7 million people aged over 60 lack the fundamental skills to navigate the web safely. This is a vital issue, as more essential services, from medical prescriptions to bus passes, move online – the impact on those excluded becomes more severe and isolating. This illustrates the transition from the ‘digital divide’ of twenty years’ ago to ‘digital exclusion’ post-2020, which shifts the emphasis from access to the impact of exclusion on people’s lives.

Age is a significant indicator, as digital exclusion disproportionately impacts those over age 65, but it is compounded by other factors. Risks are higher for those living on a low income, those with disabilities or people in geographically isolated areas, like my parents. There are also psychological barriers: for many, the hurdle isn't just access but a lack of confidence and a fear of ‘getting things wrong’ or being scammed. The challenge isn’t just taking that first step and getting online either, as once there, poorly designed platforms can assume digital literacy and fail to account for age-related needs, like font size, contrast or even manual dexterity.

Older person hands writing a list on a scrap of paper

This has real implications for everyday life, as being offline can mean being marginalised in a host of different ways. When it comes to health, it can be difficult to book GP appointments, request prescriptions or manage long-term conditions such as diabetes via digital apps. It can have financial implications if you can’t access cost-saving online deals, manage your pension, reach customer services or do your banking online. Aside from the practical disadvantages, there’s a loss of social contact in missing out on access to neighbourhood groups and family networks – the human connections that originally sparked the rise of social media.

 A new way of tackling digital exclusion

Traditional responses to the issue have been siloed. They have tended to either focus on access to devices or on surmounting the hurdle of IT education, but these assumptions don’t always address the nuanced reasons why people aren't online. To develop this further, DG Cities has been trialling a new approach for the Department for Science, Innovation and Technology (DSIT).

Instead of just trying to change individual behaviour, Behavioural Systems Mapping (BSM) maps the entire neighbourhood ‘system’, including local authorities, trusted individuals, charities and service design to identify root causes. Returning to the idea of that understanding of hyper-local systems and social mechanisms, the team has tested this in five diverse communities and we’re excited to release the resulting ‘blueprints for action’ soon. It’s a way for local authorities to move beyond generic skills training toward effective place-based interventions – a means to leverage trusted local actors and accessible service design to bring about a fundamental shift on this issue.

A flexible approach to anticipating the emerging digital divide?

At the same time, the pace and emerging capabilities of technology are becoming increasingly divisive. Not everyone wants to be online, all the time. There are movements to reduce tech-based learning platforms in schools, cut smartphone use and limit access to social media for teenagers. Many offices now have a tech-free sanctuary, digital detoxing is growing in popularity, ‘analogue’ activities are seeing a resurgence. For policymakers and local authorities, this is another aspect of digital inclusion to consider: how do we design services not just for the inadvertently digitally excluded, but also the deliberately so? How do we factor in those who reject the expectation of online-first services or AI-enabled tools: the recognition that ‘digital-first’ must not mean ‘digital-only’?

The most important factor to enable successful uptake of services is choice. This is perhaps the most exciting aspect of our latest research, as the approach we have been trialling can be applied to a range of issues, to keep pace as behaviours and technologies evolve.

Keep an eye out for more on this soon…

Managing the local impact of global energy shocks

For a council, how much will the spike in fuel prices affect the running costs of diesel bin lorries? Travel expense claims? Heating bills? As net zero ambitions take on a pragmatic dimension, we’re looking at some of the ways DG Cities has helped different councils trial innovations, grow resilience and harness the potential of new technology to make the shift to electrification and renewables.


The impacts of geopolitical instability will be felt at a local level. In homes that need heating, in transport costs, in businesses where energy is consumed, in consumer prices, housebuilding programmes – all areas where local authority budgets are already stretched to their limit.

Will the spike in fuel prices drive a more rapid than expected shift to electric cars – and are there enough charging points in your area to cope with demand? To what extent have you successfully decarbonised your council fleet? How are you using evaluation to maximise the returns on your Warm Homes-funded projects? At DG Cities, we play an important role in helping places trial, validate and scale renewable energy solutions in real-world settings. We help to turn abstract ideas into useful, scalable systems and then bring the behavioural and social understanding that will make them work.

We thought we’d take a look at some of the areas and projects where local authorities, often with industry partners, have been leading the way. 

Fleet electrification

DG Cities worked with a council to develop a costed, operationally viable strategy for fully electrifying its 500+ vehicle fleet by combining fleet, depot and usage analysis with stakeholder engagement. We assessed different scenarios: a high-cost, high-convenience model with dedicated chargers for every vehicle at main depots and two lower-cost alternatives using shared chargers, home charging, battery storage and solar integration.

By analysing telematics, mileage patterns and replacement cycles, we determined the council fleet’s charging needs, infrastructure requirements and phased vehicle replacement costs. Our depot surveys and electrical upgrade assessments then enabled full capital and operational cost estimates. Ash Dowler explains the steps in this process and you can watch our film for more on this strand of work. 

Equitable access to EV charging

As uptake of electric vehicles grows, councils need to manage the provision of EV charging. What makes a local authority’s EV charging network resilient? (Diversity, grid capacity, accessibility and more…) What are the implications for rural areas? (Our REME research looked at how adoption can be supported in the countryside.)

As with many areas of our work, there’s also the challenge of understanding the public’s perception of a technology in order to shift behaviour. The Department for Business, Energy and Industrial Strategy (BEIS), as it was then called, asked DG Cities to conduct a national survey into people’s views and understanding of EV chargers. The results shed light not only on consumer attitudes, but also on areas where improvements are needed if EV adoption is to be accelerated.

Understanding complex housing

When it comes to housing decarbonisation, a substantial challenge is dealing with complexity, when no two homes, residents or neighbourhoods are the same. Our ‘complex to decarbonise’ housing research for the UK government with UCL developed a new definition and framework to identify homes that are particularly difficult to retrofit and decarbonise.

Recognising that around 10 million UK homes can’t be improved through conventional measures, the work helped move beyond a one-size-fits-all approach by assessing a combination of physical, technical and social factors that create barriers to low-carbon upgrades. This was one of the conversations that inspired the development of our ‘home by home’ plan, which uses data and AI to help councils better manage their complex housing assets, anticipate issues and track repairs and retrofit programmes.

Changing the way we heat

Heating represents one of the most complex energy challenges for local authorities. Our research into heat pumps back in 2022 highlighted the scale of the transition required: while the technology is central to national decarbonisation strategies, when we surveyed 500 people, we found public understanding was limited and upfront costs were a major barrier to adoption. Using evidence on consumer attitudes and practical barriers, we can help councils design interventions, whether demonstration homes or financing mechanisms, that make adoption more feasible at a household level.

District heating

At a systems level, this work points to a new generation of district heating networks. With Kensa, we explored the potential of a heat pump network. Read more here on how this approach could improve efficiency while enabling the use of ambient and renewable heat sources.

Solar power

We also explored the potential of solar renewables. IDEMA was an Innovate UK–funded feasibility study set up to explore how low-carbon technologies and modern methods of construction could be integrated into small-scale residential developments. Building on this experience, we helped a local authority develop a business case to expand access to energy generated from existing roof-mounted solar panels on an estate. While some buildings already host photovoltaic systems, the proposed model would have enabled residents to share locally generated electricity, reducing household energy costs.

However, this work in particular highlighted how the challenge extends beyond installing renewable tech. It showed the need for viable local energy systems to fully address governance, billing and resident participation, as although initial interest was clear, uptake fell short of the threshold required to proceed. 


What can we learn from success and best practice elsewhere?

This was the question asked by the Sharing Cities programme, which DG Cities was part of. The programme explored a suite of low-carbon interventions, from housing retrofit to smart energy systems and proposals for a water-source heat pump network. The aim was to learn from examples in European cities to demonstrate how technologies could be applied at a neighbourhood scale.


From EV charging to electric bin lorries, home heating to experimental solar, what links all these strands of work is place-based experimentation. We work with government and the private sector to test and develop what works in specific local contexts: we generate data, we evaluate and we iterate. We know that energy resilience can’t be delivered by top-down policy. It requires local government to coordinate infrastructure, engage communities and de-risk new models through pilot projects. This is where we can bring the analytical capability, strategic and delivery support to bridge the gap between ambition and implementation.

Global climate change and geopolitics may determine the scale of the challenge, but it is through this kind of local experimentation and action that any meaningful progress is made. If your council has a tricky innovation challenge, get in touch to see how we can help: email [email protected] 

Transport innovation in Greenwich: a borough shaping the future of mobility

Following the passage of the UK Government’s Automated Vehicles Act in 2024, we’re expecting to see the first commercial self-driving taxis launched in London by the end of next year. To better understand what's happening now, Nick Reed takes us back to the deck of an automated shuttle on the Greenwich Peninsula on a cold morning in 2015. For our latest guest piece, the leader in transport innovation, founder of Reed Mobility and long-term DG Cities’ collaborator shares his perspective on a decade of self-driving advances in Greenwich.

I vividly remember the first meeting in 2014. The Department for Transport had just announced funding for projects to trial automated vehicles on UK streets, and as a director at TRL (the UK’s Transport Research Laboratory) and lead of research in this area, I was keen that we bid. However, one key question needed an answer - which streets should we choose? A colleague had connections to the Royal Borough of Greenwich and arranged the call…

With the TRL team huddled around a speakerphone in a nondescript meeting room, it was immediately apparent that our new friends from Greenwich were ready to go ‘all in’ as project partners. They recognised the need for and value of the technology, they shared our vision for what could be achieved and they had the energy, leadership, connections and political support to make it happen. Thus began the GATEway project.

The name ‘GATEway’ was deliberately capitalised as an abbreviation of Greenwich Automated Transport Environment. This highlighted our ambition that the project should not simply run a series of trials and then end, but should create something that would live beyond its conclusion - a ‘gateway’ to a future of safe, clean, accessible mobility enabled by automated vehicles. In striving for this future, we also wanted to reflect the present transport challenges that Greenwich faced and the past in which Greenwich was established as the global focus for navigation. The funding assessors at Innovate UK shared our vision and gave the project the green light.

The launch event, on a freezing February morning in 2015, saw the world’s press gather to see the automated vehicles assembled outside the O2 Arena. The various breakfast news teams jostled for position to get the best shots of the assembled vehicles and the media clamour persisted throughout the day. Colleagues from Greenwich suggested that interest in the launch exceeded that they had experienced when hosting Olympic and Paralympic events across three venues in the borough three years earlier.

(L-R) Business Secretary, Vince Cable; Transport Minister Claire Perry; Leader of the Royal Borough of Greenwich, Denise Hyland and GATEway project lead, Dr Nick Reed on the early GATEway shuttle prototype (picture courtesy of TRL). 

Following the successful launch, working closely with partners including leading insurers, RSA, mobile network provider, Telefonica and with academic support from the Royal College of Art, the University of Greenwich and Imperial College, and DG Cities, Greenwich Council’s independent innovation company, GATEway saw multiple automated vehicle types trialled in the borough.

The GATEway shuttle vehicle that offered rides to passengers on the Thames path near the O2 Arena (picture courtesy of TRL).

The GATEway teleoperated vehicle tested at the InterContinental hotel on the Greenwich peninsula (picture courtesy of TRL).

These included a passenger shuttle operating on the Thames path near the O2 Arena, a vehicle capable of being driven from a remote control centre situated in the brand new InterContinental hotel on the Greenwich peninsula and the world’s first grocery delivery by automated vehicle at the Royal Arsenal heritage site.

The GATEway automated delivery vehicle that completed the world’s first grocery deliveries (in partnership with Ocado) by automated vehicle on the Royal Arsenal heritage site (picture courtesy of TRL).

The shuttle and delivery vehicle used automated driving technology from a spinout company from the University of Oxford called ‘Oxbotica’. Now shortened to Oxa, this company has since raised hundreds of millions in funding and grown to hundreds of employees through the development of automated driving technology. Similarly, automated driving technology company, Fusion Processing supported later iterations of the GATEway shuttle and has since participated in a project called CAVForth in which the UK's first full-sized automated bus service was trialled in Scotland.

In parallel with GATEway, the Royal Borough of Greenwich announced its own radical shift. Its innovation activities would be focused in a new entity, christened ‘DG Cities’. This team could work on ground-breaking ideas that could transform services within the borough, while also sharing the learning from Greenwich with cities across the UK and internationally.

As GATEway progressed, the vision of an enduring facility to support future transport was realised by TRL and DG Cities in the form of the ‘Smart Mobility Living Lab’. This meant the Royal Borough of Greenwich’s streets could develop, trial and evaluate new forms of transport innovation for development and evaluation, from self-driving vehicles to e-cargo bikes. The concept captured the zeitgeist and won ITS UK’s Forward Thinking award for 2016, recognised as a ‘pioneering, real-life environment for testing connected and autonomous vehicles within a live urban community in London’.

Initially conceptual, the Smart Mobility Living Lab (SMLL) became a serious proposition when the government announced it was funding the development of facilities to support the growth of the UK’s automated vehicles industry. As a recipient of a significant portion of these funds, SMLL took root in a dedicated space in Woolwich offering incredible communications, monitoring, engineering and workshop facilities and office space to support mobility innovation in the borough.

The SMLL proposition was further enhanced by a partnership with the Queen Elizabeth Olympic Park across the river, which offered private roads that could be more easily configured for R&D. An early success included the Driven project. Led by Oxbotica, this trialled automated vehicles on the Olympic Park site before venturing beyond onto the public streets in London and Oxford.

Dr Nick Reed visiting an automated vehicle from the Driven project at the Queen Elizabeth Olympic Park.

Automated vehicle from the Driven project outside the Lea Valley Velopark, part of the Queen Elizabeth Olympic Park in London.

It was around this time that I began two years working for Bosch, heading up mobility R&D and helping to determine how their hugely successful business in supplying technology to the automotive sector could play a role in improving mobility for cities. This included supporting our team in the creation of the Bosch London Connectory - a unique collaborative, co-innovation space delivered in partnership with Transport for London and designed to support cooperation between industry leaders, SMEs, academia and the public sector in tackling the city’s mobility challenges. However, I had decided that it was time to start out on my own and, in 2019, started Reed Mobility as a consultancy to support the development of transport systems that are safe, clean, efficient, ethical and equitable.

Building on the success of Driven, the Oxbotica-led, Endeavour project extended the research scope by using rides in automated vehicles to explore how members of the public felt about trusting the technology to operate safely on public roads. As consortium partners, this societal aspect fell squarely into the experience of the DG Cities team, running surveys, focus groups and interviews to explore perceptions and attitudes towards automated vehicles. DG Cities also developed tools to help public sector stakeholders understand how they might engage with automated vehicles and determine whether they might bring value to their locations.

SMLL has also hosted work to support the development of automated driving systems by Nissan. They worked with an array of partners including DG Cities to explore how their self-driving systems would respond in a complex urban environment with a very different culture of road use. Nissan’s trials also explored how their automated vehicles could use information provided by infrastructure-based sensors to inform future driving behaviours - in this case, information about the status of a downstream traffic lane ahead was communicated upstream to the self-driving vehicle, helping it to select the most appropriate lane to complete its journey safely and efficiently.

Self-driving Nissan Leaf used in the ServCity project and tested in SMLL.

Winning the Rees Jeffreys Road Fund competition to investigate the ethics of self-driving vehicles in Greenwich (picture courtesy of Rees Jeffreys Road Fund).

In 2022, the Rees Jeffreys Road Fund ran a special competition to commemorate 150 years since the birth of its namesake - the roads advocate, William Rees Jeffreys. This sought ideas for projects setting out a vision for how roads could meet the challenges of the next 50 years. A joint winner of this competition was an entry by Reed Mobility entitled ‘Ethical Roads - how to deliver safe, ethical, equitable road use with automated vehicles’. Working in partnership with DG Cities and SMLL, this project used a survey and workshops to determine what members of the public considered to be their ethical ‘red-lines’ - behaviours that absolutely must (or must not) be adopted by self-driving vehicles in order for their behaviour to be considered acceptable.

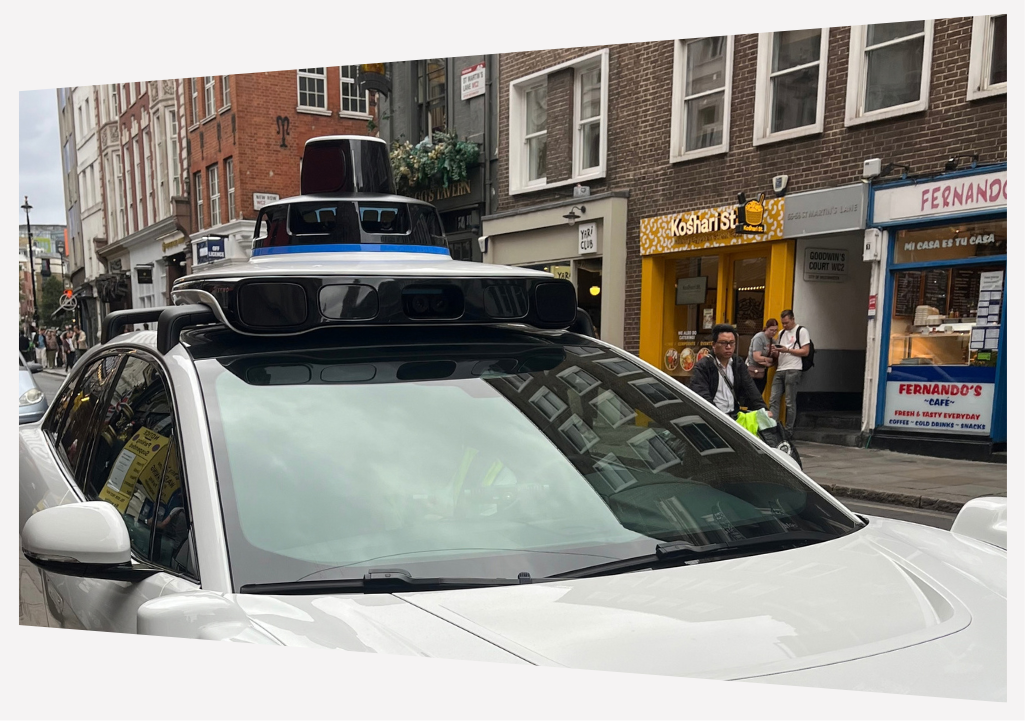
A line can be drawn from this programme of work that started in Greenwich more than ten years ago through to actions taken by the government to establish a regulatory framework to support the commercial deployment of automated vehicles. Following several consultations by the Law Commission, the Automated Vehicles Act was passed in May 2024, giving greater certainty and confidence to the industry that the UK is the right environment for this technology to reach commercial readiness and deliver societal benefit. This has attracted global leaders in self-driving technology such as Waymo, Wayve and Baidu to announce pilots of self-driving vehicle services to begin in London this year - reinforcing the value that the research in Greenwich has delivered.

In 1884, Greenwich was established as the prime meridian and as such became the global reference point for the measurement of time. However, the significance of this decision extended far beyond navigation and cartography. By providing a common reference for time, it enabled the coordination of railways, shipping and telecommunications and later helped underpin technologies such as satellite navigation and global digital networks. In effect, the standardisation of time created the foundations on which many of the complex, interconnected systems of modern life depend.

In much the same way, today’s efforts to develop and deploy automated and connected mobility systems rely on shared frameworks, trusted data and careful coordination between technology, infrastructure and public policy. The work undertaken in Greenwich and that led by DG Cities reflects a similar spirit – working to ensure that new mobility technologies realise the bright future that they promise to deliver. For more than a decade, the borough has provided a real-world testbed for ideas that may define the future of urban mobility. Greenwich helped the world measure time; it continues to shape the way we move through it.


With thanks to Dr Nick Reed of Reed Mobility. You can read more about DG Cities public research supporting the development of safe, ethical services here.

What behavioural systems mapping is teaching us about digital inclusion

We’re two-thirds of the way through our work trialling behavioural systems mapping to address digital exclusion, which is being supported by the Department for Science, Innovation and Technology Digital Innovation Fund. With our partners in five unique local authority neighbourhoods, we’ve been looking at how we can take a different approach to understanding the issue among the over 60s. Director of Research & Insights, Ed Houghton shares some of the learning so far.

As we continue our behavioural systems mapping programme on digital inclusion, one thing is already clear: the value of the work lies as much in how it changes our thinking as in what it produces.

The project, funded by the Department for Science, Innovation and Technology’s Digital Inclusion Innovation Fund, focuses on understanding digital exclusion among people aged over 60. Working across five neighbourhoods with local authority partners, we set out to test whether participatory behavioural systems mapping could offer something different to more conventional approaches. And it has - although not always in the ways we had anticipated.

Shifting the problem, not the people

Most approaches to digital inclusion frame the problem as one of access or individual behaviour: people need to be trained, encouraged or ‘nudged’ to use digital services. Behavioural systems mapping flips that logic.

Instead of asking why older people don’t engage digitally, we’re asking what organisations, services, networks and relationships are doing (or not) that make exclusion more likely in the first place. The focus moves away from ‘fixing’ individuals towards examining how the system itself produces barriers. That shift alone changes the kinds of conversations stakeholders have and the kinds of solutions that start to emerge.

The role of neighbourhoods

Digital exclusion is often analysed at the level of cohorts or administrative boundaries. Working at neighbourhood scale has exposed a much messier — and more actionable — reality.

In workshops, stakeholders quickly moved from abstract discussions to very specific issues: a housing advice service that assumes online access; a GP practice whose digital interface unintentionally excludes older patients; a lack of informal spaces where people can ask for help without feeling judged.

These details rarely appear in high-level strategies, but they are precisely where exclusion is experienced day to day. Mapping at neighbourhood level makes these friction points visible — and therefore harder to ignore.

The limits of proxy expertise

Initially, the work relied heavily on professionals and organisations who support older residents, rather than on residents themselves. While these stakeholders brought valuable insight, the limits of that approach became apparent quickly.

Without direct input from people over 60, the emerging maps reflected what the system thought was happening, not always what actually was. Early engagement with residents has already challenged several assumptions about how people navigate digital services and where they experience difficulty.

The lesson was uncomfortable but important: no amount of professional expertise can substitute for lived experience when mapping behaviour.

Being in-person matters

Although digital workshop tools are effective, in-person mapping proved to be qualitatively different. Spending time together in the neighbourhoods being discussed grounded conversations in physical reality.

Seeing transport links, community spaces, and patterns of isolation first-hand added depth to the maps that would have been difficult to achieve remotely. The method benefited not just from participation, but from proximity. For place-based challenges, the environment is part of the system and ignoring it weakens the analysis.

Mapping as a social intervention

One of the less anticipated outcomes has been the effect of the process on stakeholders themselves. Time and again, participants expressed surprise at what others in the room were doing, or frustration that they hadn’t been working together sooner.

The workshops became spaces for connection as much as analysis. Mapping revealed gaps and overlaps, but it also created relationships that didn’t previously exist. In that sense, the process acted as a form of intervention in its own right.

Evaluating the method

The flexibility of behavioural systems mapping makes it applicable to many complex challenges, from climate action to transport, energy, and food systems. Its strength lies in making complexity visible without immediately collapsing it into a single solution.

But that same flexibility carries risks. Maps can become overly abstract, flatten nuance or drift away from any clear purpose. Without discipline, the method can produce elegant representations that are difficult to act on. The key is continual reflection: why are we mapping, who is it for and what decisions should it inform?

Looking ahead

Now we’re at the end of our workshops, we’re analysing and developing the final outputs and, already, the learning feels exciting and worthwhile. Behavioural systems mapping, done well, is forcing a re-examination of assumptions about scale, expertise, participation and responsibility. The challenge is to ensure that what has been learned doesn’t remain tied to a single project or method, but informs how complex social issues are approached more broadly in practice.


The bus stops here: can deregulation be the enemy of innovation?

Debate about the future of bus services in the UK tends to focus on technology: zero-emission fleets, automation, smarter ticketing... Less focus is on the underlying structure of the bus networks themselves. Who coordinates them? How are decisions made about services and procurement? Over the last few months, Balazs Csuvar and Ash Dowler of DG Cities have been working on a UK Government-funded project exploring the feasibility of deploying automated shuttle services in Glasgow.

What began as a technical and operational exercise became a useful, practical examination of how deregulated bus networks function in practice. And the implications for innovation, as Director of Innovation & Net Zero, Balazs Csuvar explains.

Imagine a bus network where routes and timetables are coordinated, fares are standardised, data is collected centrally and analysed to decide where adjustments need to be made to the system. Imagine that this work is done by a central public body, one that ensures a high standard of bus operational efficiency and passenger satisfaction is achieved.

If you live in London, this might seem familiar. The above system pretty well describes the network with Transport for London at the helm - necessary, given the capital’s scale and multi-modal transport. This is, however, not the case in almost all other areas in the UK.

Over the last nine months, DG Cities has been delivering a UK Government-funded project looking at the potential feasibility of an automated shuttle service in Glasgow. When reviewing how an automated service might fit into the existing public transport system, we wanted to find out how the current network operates. We were interested in understanding where provision doesn’t meet demand, for example, or where large buses might be running below capacity at different times of day. We wanted to build the business case, without infringing on parts of the bus routes that are operating successfully.

However, we found that it was pretty much impossible to do this.

Bringing a new service to a deregulated network

Glasgow, like most other UK cities apart from London (and more recently Greater Manchester), has had a deregulated bus network since 1986. This means that private bus operators decide timetables, routes and fares for their bus services. In theory, one can turn up, drive across the city in a bus and collect a fare from passengers.

From a commercial perspective, however, there is very little to no information available on which bus routes are busy, underserved or overserved that could help a new entrant figure out where to direct a new service. Operators do not have to share this data with the regulatory body that oversees public transport in the city region, which means they cannot effectively intervene or orchestrate the bus network. As a Londoner, this feels quite far from what we are used to, where TfL is constantly tweaking the system to make it run more efficiently, using all its travel data across all travel modes to have the best chance for the most effective data-driven decisions.

There is appetite for change. Glasgow is looking to move to a franchising model and in their consultation, they found both the public and relevant organisations to be overwhelmingly in support of changing the current system. This will play out over the coming years, in a similar way to other initiatives in places like Liverpool, across Yorkshire or the West Midlands, to name a few. 

For us, the scenario was interesting, as we essentially tested the supposed benefit of a deregulated system - the ability for a new provider to start a service of their choice, providing alternatives for travellers, innovate and reduce costs.

However, the benefits of this in practice were limited. The overwhelming market penetration of the incumbent operators and their total ownership of all travel data make it challenging to understand where to focus attention. There is no option to make the network more efficient, reconsider a few routes or timetables - one can only put a new proposal together that financially has to stand on its own. This means likely a focus on central areas to have the best chance of finding sufficient users. 


Mapping the road ahead

As a new technology, automated vehicles (and the smaller, more flexible shuttle formats they enable) are often presented as a way to work around the constraints of existing public transport systems. In practice, they do the opposite: they expose those constraints more clearly.

...effective public transport requires coordination and an authority with the mandate to balance commercial viability with public value. These changes take time. There is no single model that can simply be lifted from London and applied elsewhere. But the current direction of travel matters.
— Balazs Csuvar

Cities like Glasgow are not failing to innovate. They are operating within governance and market structures that were never designed for today’s network-level optimisation, data-led decision-making or dynamic integration across modes. Expecting new services to deliver systemic benefits in this context places an unreasonable burden on individual projects, technologies and operators to solve problems that are fundamentally structural.

Whether we’re assessing automated shuttles or other emerging mobility solutions, this transition creates a new opportunity. Their flexibility makes them well suited to filling gaps, responding to time-of-day demand and supporting areas that struggle to sustain high-capacity services. To unlock that potential, cities need to map how their networks currently function and, from this, enhance the ability to shape them deliberately.

With the right data, governance, and partnerships in place, innovation does not have to compete with existing services or concentrate only where demand is already strongest. Instead, it can become part of a more coherent, responsive system that reflects local needs and evolves over time. In that sense, projects like this are not just about testing new technologies, but about helping cities build the conditions in which innovation can genuinely add value.

Thanks to all who supported, hosted, spoke to us and enabled our research in Glasgow, it’s been a great experience and we have learnt a lot to take forward.

Notes from DG Cities

What better way to counter January’s ‘blue Monday’ than with some thoughtful reading? And it just so happens we’ve published our new ‘notes’ on Substack.

Four our first piece (How much road is too much: where’s your double yellow line?) we’re considering the impact of cars on cities and how the balance is negotiated. For us, the real question isn’t just spatial but connected to people’s values and identity. How much public space do you think should be given over to vehicles versus people?

Objective analysis of survey and usage information isn’t always heard. For example, data from London’s Low Traffic Neighbourhoods has shown a reduction in traffic and increase in active travel, countering many common fears, but national culture wars and social media have often been cited to distort and politicise local debates. In our projects, we’re exploring how behavioural systems mapping can help us understand the wider reasons why, for example, people choose to drive, walk or cycle - and from this finding useful insights to guide policy and deliver positive change.

Looking forward, emerging technologies such as autonomous vehicles will raise further questions about who gets to use our streets and for what purpose, with further ethical questions raised around the decisions made by the technology itself. Unless human experience remains central, cities risk repeating past mistakes of designing around cars rather than around people. Read more: dgcities.substack.com


We have started this as an experiment; a way to explore some of the issues around our projects and show a little more of our workings out. We set up these notes as a space for thinking beyond the DG Cities team’s day-to-day work and inviting new perspectives and authors. There’s a lot going on in our Slack channels, studio chats and team lunches that we’d like to make sure we don’t miss.

We hope to share more of the thoughts, experiments and wider context around our projects. We want to delve a little more into the wider issues shaping our neighbourhoods and cities, from behavioural science research to housing innovation to advances in self-driving and the points where tech meets real people and their needs.

You’ll (hopefully) find writing from the DG Cities team alongside pieces from collaborators and people doing interesting work that intersects with ours in different ways. It’s a pilot. We’re trialing this Substack as a place to show the workings out, so if you’re curious about what we do, how cities adapt, evolve and imagine what comes next, subscribe, contribute (and feel free to get in touch).

Project news: start of new DfT research into public perceptions of automated vehicles

DG Cities is to deliver national public research on the proposed Statement of Safety Principles for automated vehicles for the UK Government’s Department for Transport. Read on for more about the scope, aim and how we’ll be working with local groups.


DG Cities has launched a series of public workshops across the UK to explore public perceptions of how the capabilities of automated vehicles will be benchmarked and evaluated, on behalf of the Department for Transport (DfT). Working with partners, Reed Mobility and DJS Research, the Statement of Safety Principles study is a key part of government policy development, designed to make sure public views shape emerging legislation. The findings will directly inform the development of future policies and laws, ensuring that automated vehicles can be introduced safely onto UK roads.

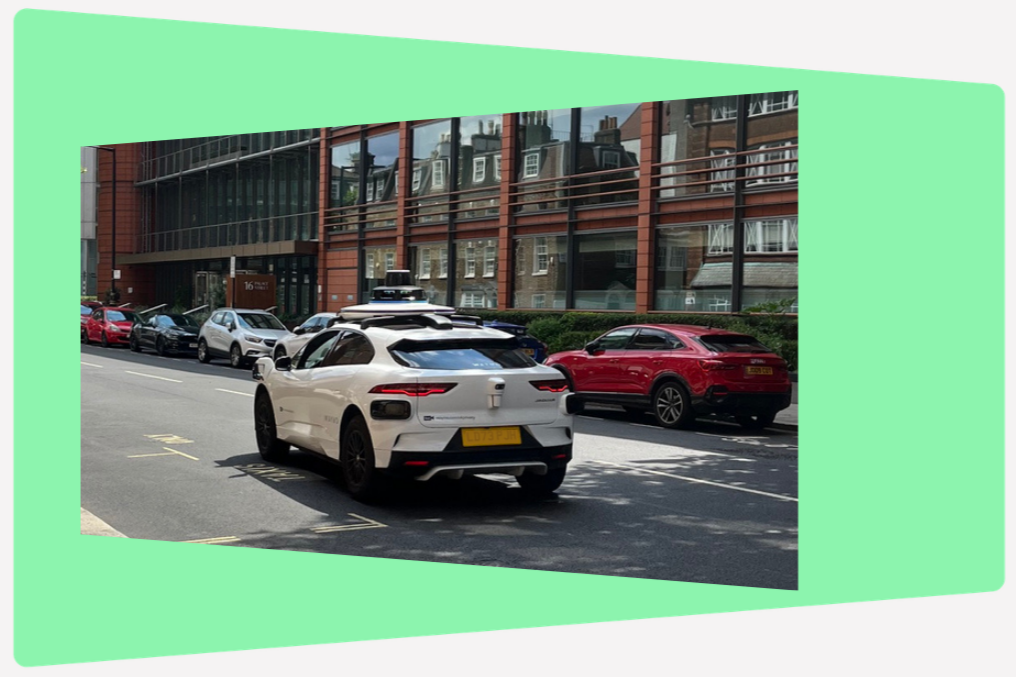
The research phase runs from December 2025 to March 2026 and will include face-to-face workshops held in rural and urban locations across the country. Key themes for discussion will explore views on general road safety and benchmarking of ‘careful and competent’ driving.

“Understanding the public's perspective is vital for building trust and ensuring that future transport policies reflect the needs and concerns of all road users,” said Balazs Csuvar, Director of Innovation & Net Zero at DG Cities. “We aren’t only speaking to drivers, we are inviting road users of different ages and backgrounds so that we can feed in the widest possible range of perspectives.”

Participants will be invited to their local venue for a single session, which is expected to last up to 3.5 hours and all data and insights will be anonymised to support transparency and open feedback.